
Monitoring performance counters is critical for optimizing Oracle Database performance. Here are ten significant performance counters (also called as performance metrics or statistics) to consider while analyzing an Oracle 19c database’s performance:
Buffer Cache Hit Ratio-
Indicates the efficiency of the buffer cache by measuring the ratio of cache hits to total requests.

Query-
SELECT 1 – (SUM(decode(name, ‘physical reads’, value, 0)) / SUM(decode(name, ‘db block gets’, value, 0))) AS buffer_cache_hit_ratio
FROM v$sysstat;
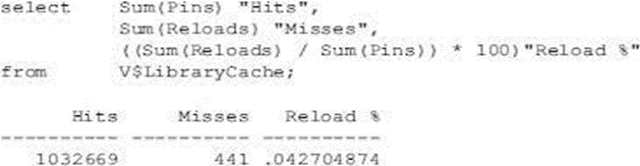
Library Cache Hit Ratio-
Measures the efficiency of SQL and PL/SQL statement caching by showing the ratio of hits to total requests in the library cache.
Query-
SELECT SUM(pinhits)/SUM(pins) AS library_cache_hit_ratio
FROM v$librarycache;
Latch Contention-
Identifies latch contention by monitoring latch statistics
Query-
SELECT name, gets, misses, sleeps
FROM v$latch
WHERE sleeps > 0;
Wait Events-
Monitors various wait events to identify what the database is waiting on.

Query-
SELECT event, total_waits, time_waited
FROM v$system_event
WHERE event NOT LIKE ‘%idle%’
ORDER BY total_waits DESC;
CPU Usage-
Monitors CPU-related statistics, such as CPU usage percentage.

Query-
SELECT ROUND(value, 2) AS cpu_usage_percentage
FROM v$osstat
WHERE stat_name = ‘BUSY_TIME’;
Disk I/O Statistics-
Monitors read and write I/O operations to identify potential disk I/O bottlenecks.
Query-
SELECT file#, name, phyrds, phywrts
FROM v$filestat;
PGA and SGA Memory Usage-
Tracks PGA and SGA memory usage to ensure efficient memory utilization.
Query-
SELECT * FROM v$pgastat;
SELECT * FROM v$sgastat;
SQL Statement Execution Times-
Identifies long-running or frequently executed SQL statements.

Query-
SELECT sql_id, elapsed_time, buffer_gets, disk_reads
FROM v$sql
WHERE elapsed_time > 1000 — Adjust as needed
ORDER BY elapsed_time DESC;
Active Session History (ASH)-
Reviews active session history to analyze and troubleshoot database performance at the session level.

Query-
SELECT sample_id, session_id, user_id, program, sql_id, event, wait_class, time_waited
FROM v$active_session_history
WHERE sample_time > SYSTIMESTAMP – INTERVAL ‘1’ HOUR; — Adjust time window as needed
Temp Space Usage-
Monitors temporary tablespace usage, especially during complex queries or sorting operations
Query-
SELECT tablespace, used_blocks, free_blocks, round(used_blocks * 8 / 1024, 2) AS used_mb
FROM v$sort_segment;
Leave a Reply